Waffle House Index: America’s Disaster Barometer Explained
Waffle House Index measures disaster impact by diner status. Learn how this unique barometer helps assess recovery efforts and community resilience.
What Is the Waffle House Index?
The Waffle House Index is an informal but widely recognized metric used to assess the severity of natural disasters and the recovery needs of affected communities. Named after the Southern U.S. restaurant chain Waffle House—known for its 24/7 operations—the index measures disaster impact based on whether these diners are open, closed, or operating with a limited menu.
Why Waffle House?
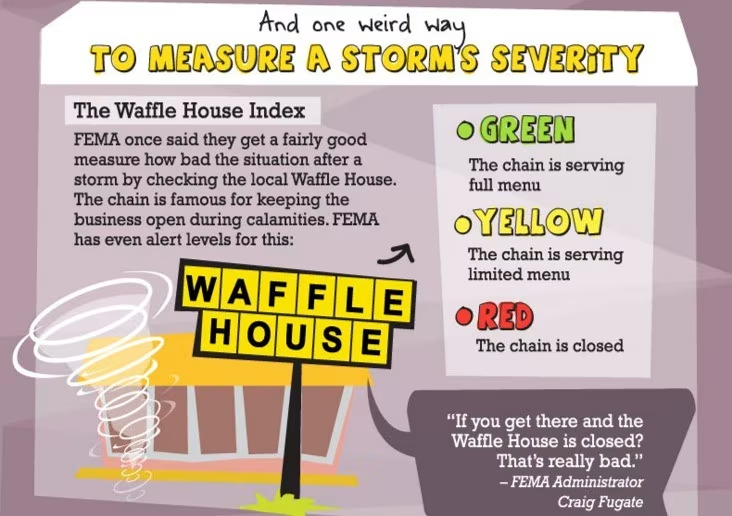
Waffle House’s reputation for staying open during hurricanes, tornadoes, and floods—or reopening swiftly afterward—makes it a unique indicator of community resilience. Former FEMA Administrator Craig Fugate coined the term in 2011 after noticing that Waffle Houses remained operational even in areas ravaged by disasters like the Joplin tornado.
How the Waffle House Index Works
The index uses a three-tier color-coded system to categorize disaster severity:

| Level | Status | Implications |
|---|---|---|
| Green | Full menu available | Minimal damage; power and supplies are stable. |
| Yellow | Limited menu | Power outages, generator use, or low food supplies; partial operations signal moderate damage. |
| Red | Closed | Severe destruction, unsafe conditions, or significant flooding; recovery will be prolonged. |
For example, during Hurricane Milton (2024), Waffle House closures in Tampa and Fort Myers signaled a “red” alert, prompting FEMA to prioritize aid to these regions.
The Origins of the Waffle House Index
From Tornadoes to Federal Policy
The concept emerged in 2011 when Fugate, then FEMA Administrator, observed that two Waffle House locations in Joplin, Missouri, stayed open after an EF5 tornado destroyed much of the town. His now-famous quote: “If you get there and the Waffle House is closed? That’s really bad”—highlighted the chain’s role as a disaster litmus test.
Waffle House’s Disaster Playbook
The company’s resilience stems from meticulous preparedness:
- Jump Teams: Rapid-response crews (contractors, food suppliers, etc.) deploy to repair stores and restock supplies.
- Generators and Gas Stoves: Locations use backup power and non-electric cooking methods to serve basics like coffee and eggs during outages.
- Social Media Updates: Real-time maps on platforms like Twitter/X track closures and reopenings during storms.
Real-World Applications: Case Studies
1. Hurricane Helene (2024)
- Closures: 20+ Waffle Houses in the Carolinas and Georgia stayed closed for weeks, reflecting prolonged damage.
- Limited Menus: Locations with partial operations became hubs for first responders and displaced residents.
2. Hurricane Ian (2022)
- Unprecedented Closures: 35 Florida locations shut down pre-storm—a rare “red” alert—before Ian’s Category 5 landfall.
3. Hurricane Katrina (2005)
- Lessons Learned: Over 100 closures led Waffle House to refine its disaster protocols, emphasizing faster reopenings to boost community morale.
Criticisms and Limitations
While the index offers quick insights, experts caution against overreliance:
- Preemptive Closures: Stores may shut down for employee safety before a storm hits, skewing the index’s damage assessment.
- Regional Bias: Most Waffle Houses are in the Southeast, limiting its utility in other disaster-prone areas like California.
- Informal Metric: FEMA uses it as a supplementary tool, not a formal data source.
The Bigger Picture: What the Index Teaches Us
1. Private Sector Resilience
Waffle House’s strategies—like pre-positioned supplies and cross-training staff—highlight how businesses can bolster community recovery. Similar approaches are used by Walmart, Home Depot, and Lowe’s.
2. The Human Factor
A functioning Waffle House isn’t just about food; it’s a psychological anchor. As FEMA’s Dan Stoneking noted, reopened businesses signal hope and normalcy, accelerating economic recovery.
3. Climate Change and Future Disasters
With hurricanes intensifying, the index underscores the need for adaptive infrastructure. However, initiatives like Project 2025—a controversial plan to downsize FEMA and privatize weather services—could undermine such grassroots metrics.
How to Interpret the Index During a Crisis
For residents in disaster zones:
- Green: Stay alert but prepare for minor disruptions.
- Yellow: Expect power/water shortages; conserve supplies.
- Red: Evacuate if possible or brace for long-term recovery efforts.
For example, during Hurricane Milton, Floridians used Waffle House’s closure map to decide whether to evacuate.
Beyond Waffles: Other Informal Disaster Metrics
- The Home Depot Effect: Surges in generator sales predict storm severity.
- Big Mac Index: The Economist’s currency comparison tool, unrelated to disasters but similarly quirky.
- Lowe’s Inventory Tracking: Increased purchases of plywood and tarps signal community preparedness.
FAQs About the Waffle House Index
Q: Does FEMA officially use the Waffle House Index?
While FEMA references it informally, the agency denies formal integration into response protocols.
Q: Has a Waffle House ever stayed open during a Category 5 hurricane?
Yes. During Hurricane Michael (2018), some locations operated on generators despite catastrophic damage.
Q: Can the index predict a storm’s financial impact?
Indirectly. Prolonged closures often correlate with higher recovery costs and insurance claims.
Conclusion: Why the Waffle House Index Matters
The Waffle House Index is more than a viral curiosity—it’s a testament to human ingenuity in crisis. By transforming bacon, eggs, and waffles into a disaster barometer, it reminds us that resilience often hinges on everyday institutions. As climate change escalates, such metrics will become vital in bridging the gap between government action and grassroots survival.